June 11, 2019
June 11, 2019
June 4, 2019
June 6, 2019
June 14, 2019
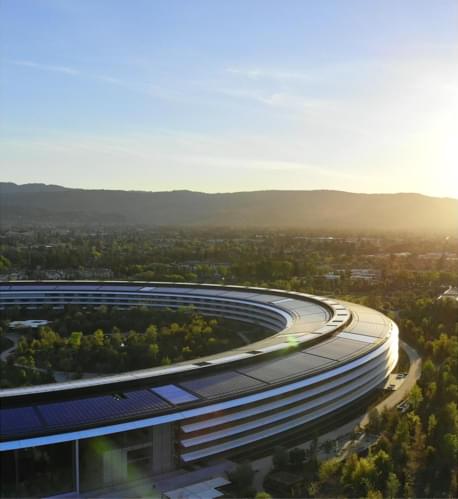
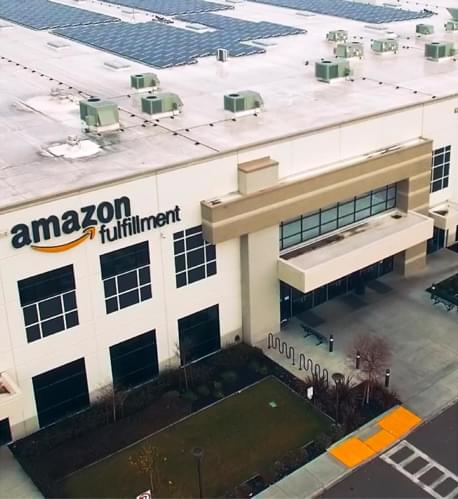
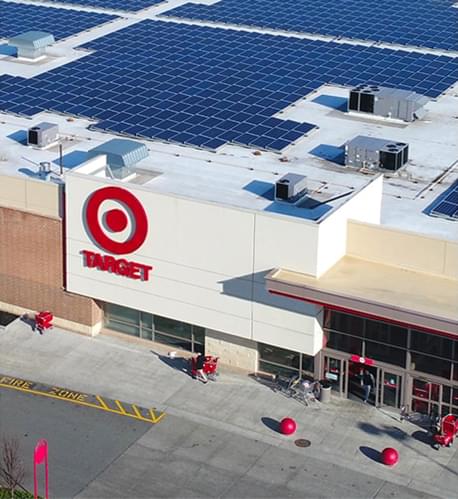
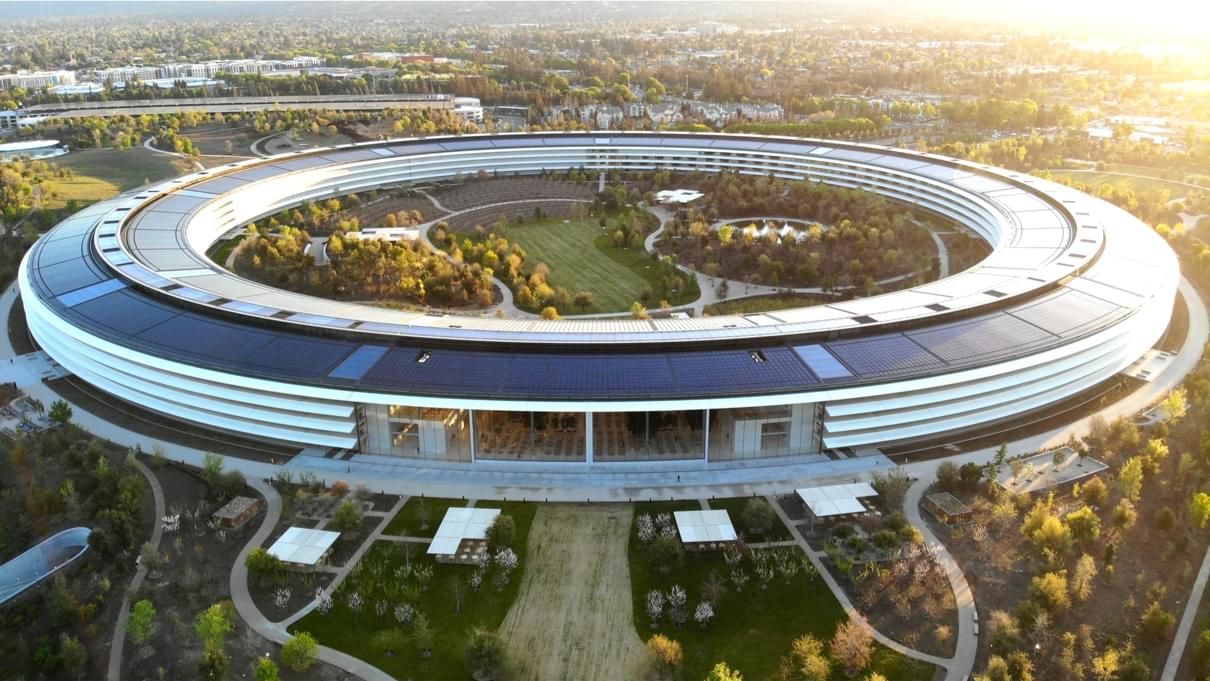
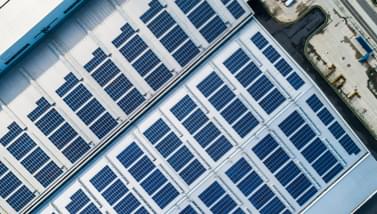
U.S. businesses are increasingly turning to solar energy as a cost-effective means of powering their operations. As of 2018, Apple leads the nation with the most solar capacity installed, followed closely by Amazon, Target, Walmart and Switch...
SEIA’s seventh annual Solar Means Business Report follows solar adoption by businesses across the U.S., ranging from some of the country’s largest and most recognizable brands to the small businesses that make up our communities. For the first time, the 2018 report captures large off-site installations, as well as data on solar systems located at the site of the businesses themselves. Both installation types have grown considerably in recent years.
Through 2018, this report tracks more than 7,000 megawatts (MW) of installed solar capacity across 35,000 projects in 43 states, representing more than 70% of all commercial solar capacity installed in the U.S.
Share this data
| Installed Capacity (MW) | ||
| 1. | Apple | 393.3 |
|---|---|---|
| 2. | Amazon | 329.8 |
| 3. | Target | 242.4 |
| 4. | Walmart | 208.9 |
| 5. | Switch | 179.0 |
| Installed Capacity (MW) | ||
| 6. | 142.9 | |
|---|---|---|
| 7. | Kaiser Permanente | 140.0 |
| 8. | Prologis | 126.3 |
| 9. | Equinix | 105.0 |
| 10. | Solvay | 81.4 |
As the solar options available to U.S. businesses have expanded, so too has the number of companies choosing solar as their preferred energy source. From rooftop systems for local hardware stores, to solar parking canopies supporting a corporate headquarters, to large solar installations powering data centers, the solar installations are as diverse and varied as the companies themselves.
The map below shows every commercial solar installation tracked in this report, with the size of each bubble corresponding with the system’s size.
Looking to dive into the world of commercial solar? Register for SEIA’s Solar Goes Corporate: Where Clean Energy Buyers and Providers Converge in Washington, D.C. on November 7, 2019.
RegisterNotice something missing? Submit additional data on commercial solar projects to be included in this report.
Access a downloadable version of the Solar Means Business Report, including additional analysis and methodology.
SEIA Members have access to the full Solar Means Business dataset, including detailed project-level information.
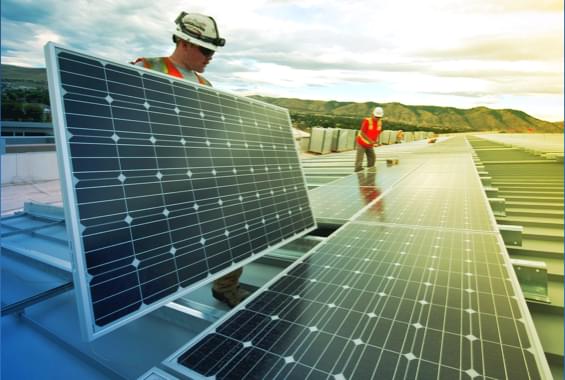
Companies turn to solar for many reasons: to power their operations, to meet environmental goals or simply to save money. No matter the reason, going solar is simply a smart business decision. The companies below have gone all in on solar, installing more capacity than any of their peers. Whether it’s to support cloud computing, to power retail centers, or to manufacture products, these companies are using solar to move their operations forward.
But not every company in the list below started out on top. Use the interactive charts below to see how many of the leading corporate brands in America have increased their investment in solar energy over time.
After mixed growth in the early part of this decade, corporate solar adoption has surged over the past several years, with more than half of all capacity installed since 2016. Over that time period, Amazon leads all corporates with 329.8 MW installed, followed by Apple at 303 MW. Falling prices and more flexible financing and procurement options have led to rapid growth in off-site corporate solar adoption, which made up more than a third of all commercial solar activity in 2018. Today, the 7,000 MW of commercial solar installations generate 10.7 million MWh of electricity annually, enough to power 1.4 million homes.
The price to install an on-site commercial solar PV system has fallen by 63% over the last decade, allowing corporate customers to increase the size of their solar PV systems and power larger shares of their operations. This has also had a meaningful impact on corporate climate goals, with commercial solar PV systems offsetting 7.5 million metric tons of CO2 annually, equivalent to taking 1.6 million cars off the road each year.
It’s no coincidence that many of the leading corporate solar investors are also America’s most innovative and successful companies. But success can be measured in many ways, and the same is true for corporate solar excellence. The rankings below tease out business leaders in overall solar installed, on-site solar capacity, and total number of installations.
| Capacity (MW) | ||
| 1. | 393.3 | |
|---|---|---|
| 2. | 329.8 | |
| 3. | 242.4 | |
| 4. | 208.9 | |
| 5. | 179.0 | |
| Capacity (MW) | ||
| 6. | 142.9 | |
|---|---|---|
| 7. | 140.0 | |
| 8. | 126.3 | |
| 9. | 105.0 | |
| 10. | 81.4 | |
| Installations | ||
| 1. | 464 | |
|---|---|---|
| 2. | 375 | |
| 3. | 230 | |
| 4. | 159 | |
| 5. | 108 | |
| Installations | ||
| 6. | 104 | |
|---|---|---|
| 7. | 66 | |
| 8. | 62 | |
| 9. | 61 | |
| 10. | 55 | |
| Capacity (MW) | ||
| 1. | 229.7 | |
|---|---|---|
| 2. | 152.1 | |
| 3. | 126.3 | |
| 4. | 85.3 | |
| 5. | 69.8 | |
| Capacity (MW) | ||
| 6. | 63.4 | |
|---|---|---|
| 7. | 55.9 | |
| 8. | 52.7 | |
| 9. | 51.4 | |
| 10. | 50.8 | |
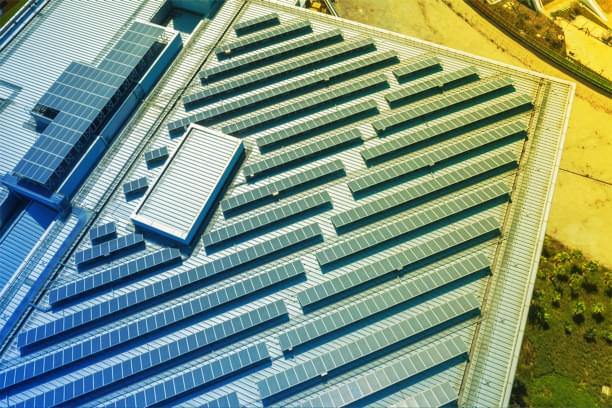
Commercial solar installation density varies across the country depending on the unique environmental, economic and regulatory characteristics of each state. The top states hit the sweet spot in all three categories, while those looking to catch up are often just a smart policy decision away from realizing the economy-wide benefits solar can bring to the business community.
Browse the map to learn more about the top commercial solar adopters in your area.
Tracked solar capacity is not inclusive of every commercial installation in a given state. See methodology in full report.